Make sure to use the latest nightly (not stable) or to work directly with the latest libGDX code (also make sure to manually update natives in the latter case). The issue you’re having might already be solved.
If you encounter a problem when using the Bullet Wrapper, it can be sometimes difficult to find the cause of the problem. For example, you might see an error like:
# A fatal error has been detected by the Java Runtime Environment:
#
#  EXCEPTION_ACCESS_VIOLATION (0xc0000005) at pc=0x000000006a49a450, pid=4040, tid=3912
#
# JRE version: Java(TM) SE Runtime Environment (8.0_05-b13) (build 1.8.0_05-b13)
# Java VM: Java HotSpot(TM) 64-Bit Server VM (25.5-b02 mixed mode windows-amd64 compressed oops)
# Problematic frame:
# C  [gdx-bullet64.dll+0x19a450]
#
# Failed to write core dump. Minidumps are not enabled by default on client versions of Windows
#
# An error report file with more information is saved as:
# C:\Xoppa\code\libgdx\tests\gdx-tests-lwjgl\hs_err_pid4040.log
#
# If you would like to submit a bug report, please visit:
#   http://bugreport.sun.com/bugreport/crash.jsp
# The crash happened outside the Java Virtual Machine in native code.
# See problematic frame for where to report the bug.
#
AL lib: (EE) alc_cleanup: 1 device not closed
If you look at the log file it generated, then you will see that it contains a bit more information. E.g. the stack trace of the java call. But it will not provide you much useful information about what actually went wrong inside the bullet wrapper. This is because the wrapper delegates the java calls to the native (C++) library. By default this library (e.g. on windows this would be a .dll file) doesn’t contain any debug information.
It is possible to compile the Bullet Wrapper with debug information and even trace into the C++ wrapper and bullet code. For most problems, however, this is not necessary. The cause of most common problems can be found by inspecting the java code.
The most common problem with the Bullet wrapper is caused by not properly maintaining references when you actually still need it. This will cause the garbage collector to destroy the native (C++) object and your application to crash. Because you can’t control the garbage collector, this problem might appear more frequently on different devices. See the creating and destroying objects section for more information.
Debugging on Windows
To debug the native C++ code it is necessary to build the bullet.dll with debug information.
Getting the sources
To do this we will need the source code of the bullet wrapper. So head to the libGDX github repo and either download the whole repository as a .zip file, or clone it via git (git clone https://github.com/libgdx/libgdx.git). Remember that the Java project you’ll be debugging has to use the very same libGDX version for which you’ll be compiling gdx-bullet (preferably bleeding-edge SNAPSHOT one) - otherwise you’ll probably get nasty low-level Java exceptions thrown everywhere due to export mismatches etc.
Getting the compiler/IDE
Furthermore we need an IDE for the debugging as well as the compiler to build the dll. We get both these things with Microsoft Visual Studio Express 2013. An .iso file with the installation can be downloaded here. After downloading it, to install it you will either need to burn the image on a CD or mount it via a virtual CD drive (for example with Daemon Tools). The following steps will work out-of-the-box only on VS Express 2013. For example, to build on VS 2010 SP1, you’ll have to change ToolsVersion="12.0" to ToolsVersion="4.0" & <PlatformToolset>v120</PlatformToolset> to <PlatformToolset>v100</PlatformToolset> in all the project files. The code should compile without errors on any reasonably recent build toolset (verified for VS 2010 SP1 as of November 2014), YMMV.
Building the debug .dll
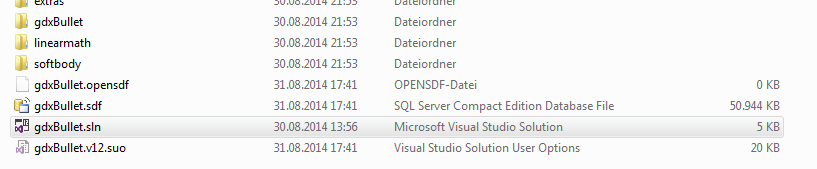
This is really easy as you will find a Visual Studio Project (.sln “Solution”) in the sources which should be able to work out of the box. You can find it in the libGDX repository at libgdx\extensions\gdx-bullet\jni\vs\gdxBullet\gdxBullet.sln.
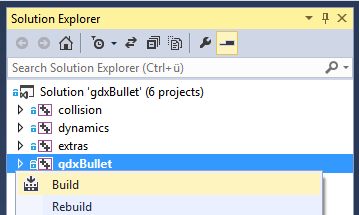
After opening the solution with Visual Studio there should 6 projects visible. The most important one is gdxBullet. In the toolbar at the top you need to select the correct build configurations. Make sure to select Debug and either Win32 or x64. The platform does not depend on your Windows version, but on the version of the JVM which you are going to use to run your application. On a 64bit Windows system it is still possible (and quite common) to run a 32bit Java version.
Now right-click the gdxBullet project in the solution exporer and hit “Build”. This will build the gdxBullet.dll, which might take a few minutes.
Loading the correct DLL
Usually to load the natives to run bullet it is necessary to call Bullet.init(), which will do exactly that. Since we do not want to load the default natives without debug information included, we have to manually load our newly created gdxBullet.dll ourselves. You can use the following code snippet to do so. Just replace the customDesktopLib string with the actual path. Then call the initBullet() method where you’d normally call the Bullet.init() method (e.g. in the create method).
// Set this to the path of the lib to use it on desktop instead of the default lib.
private final static String customDesktopLib = "C:\\......\\libgdx\\extensions\\gdx-bullet\\jni\\vs\\gdxBullet\\x64\\Debug\\gdxBullet.dll";
private final static boolean debugBullet = true;

static void initBullet() {
	// Need to initialize bullet before using it.
	if (Gdx.app.getType() == ApplicationType.Desktop && debugBullet) {
		System.load(customDesktopLib);
	} else {
		Bullet.init();
	}
	Gdx.app.log("Bullet", "Version = " + LinearMath.btGetVersion());
}
Attaching the debugger
Now it’s time to start your app and attach the C++ debugger. First, we need to start the Java app. It is a nice way to set a breakpoint at the startup of your app and then run it in debug mode. That way we’ll have a lot of time to attach the C++ debugger. To do that, we switch to Visual Studio and Select Debug -> Attach to Process....
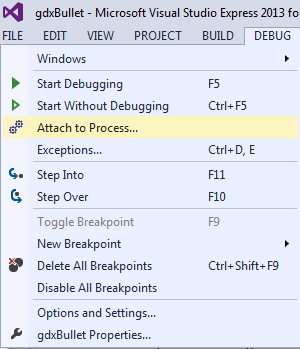
Then select the correct javaw.exe process of your app in the list of available processes and attach the debugger with the “Attach” button.
Note: with MS VC++ 2010 Express you’ll have to first enable Tools->Settings->Expert Settings to get an option to attach to process.
Debugging
For testing if this setup works one might add a breakpoint to btDiscreteDynamicsWorld.stepSimulation. The file containing this code is in gdxBullet -> Source Files -> BulletDynamics -> Dynamics -> btDiscreteDynamicsWorld.cpp.
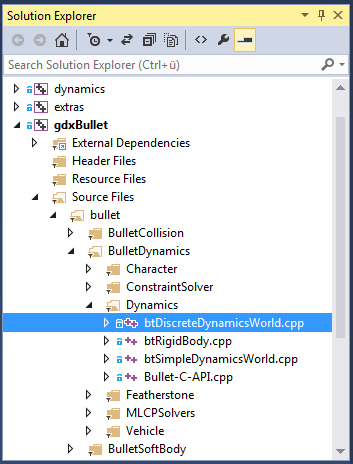
Search for int btDiscreteDynamicsWorld::stepSimulation( btScalar timeStep,int maxSubSteps, btScalar fixedTimeStep) and add a breakpoint via a doubleclick left of any code within this method.
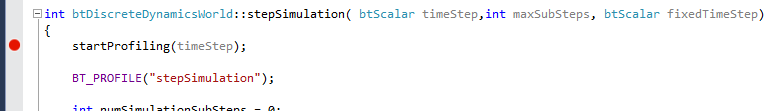
In case you stopped in a breakpoint on the Java side of the application, it is now time to remove that and resume the process. As soon as your Java code will call btDiscreteDynamicsWorld.stepSimulation you should now be able to switch to Visual Studio and see that the debugger kicked in and you are able to step through the code.